Solar Panel Inspection from Drone Images
Turn drone thermal and RGB surveys of solar plants into a checked defect register mapped to block, inverter, string and module, ready for O&M work orders and warranty evidence.
- Capability:
- Computer Vision
- Industry:
- Energy, Mining & Utilities
Who it is for
- Head of Solar O&M
- Asset Manager, Renewables
- Plant In-charge
- Drone Inspection Service Provider
The problem
Utility-scale solar plants commission drone thermography to find hotspots, failed bypass diodes, disconnected strings and broken glass. The flight itself is quick; turning the resulting stack of radiometric images into a defect list a technician can find on the ground is the slow part.
Manual tagging of every frame
Analysts scroll through thermal frames one by one, so reports lag the flight and defects keep costing generation in the meantime.
Defects not tied to the layout
A hotspot marked on an image is of little use if the technician cannot locate the table, string and module position in the field.
Inconsistent severity grading
Different vendors and analysts grade the same anomaly differently, which makes year-on-year comparison and contractor performance hard to judge.
Weak evidence for warranty claims
Module suppliers and EPC contractors ask for clear thermal and visual evidence per module, which is slow to assemble by hand.
What we build
We build an analysis pipeline for drone surveys of ground-mounted and large rooftop plants. It takes radiometric thermal and RGB images with flight logs, rejects frames captured outside valid conditions and georeferences the rest onto your plant layout. Models detect and classify anomalies such as single-cell hotspots, bypass diode and substring patterns, whole-module heating, string outages, cracked glass, soiling and shading. Temperature differences are computed against neighbouring modules from the radiometric data. Each anomaly is mapped to block, inverter, string and module position, graded with your severity rules and reviewed by a thermographer where confidence is low. The output is a defect register, an evidence report and work orders.
- Detects hotspots, bypass diode and substring patterns, module heating and string outages
- Flags cracked or broken glass, soiling, bird droppings and vegetation shading from RGB images
- Computes temperature difference against neighbouring modules from radiometric data
- Maps every anomaly to block, inverter, string, table and module position
- Compares surveys over time to show new, persisting and repaired defects
- Cross-checks string outages against string current data from the monitoring system
How it works
- 01Upload the surveyThe drone team uploads thermal and RGB images with flight logs, and irradiance and ambient readings come from the plant weather station.
- 02Check capture conditionsFrames taken at low irradiance, steep angles or with motion blur are flagged for re-flight instead of being analysed.
- 03Detect and classify anomaliesModels find and classify anomalies and compute temperature differences from the radiometric data.
- 04Map to the plant layoutGeoreferencing places each anomaly on the block, inverter, string and module layout from your as-built drawings.
- 05Thermographer reviewLow-confidence classifications and high-severity findings are reviewed by a qualified thermographer or O&M engineer.
- 06Issue register and work ordersThe approved defect register, evidence report and work orders go to the O&M team and the CMMS.

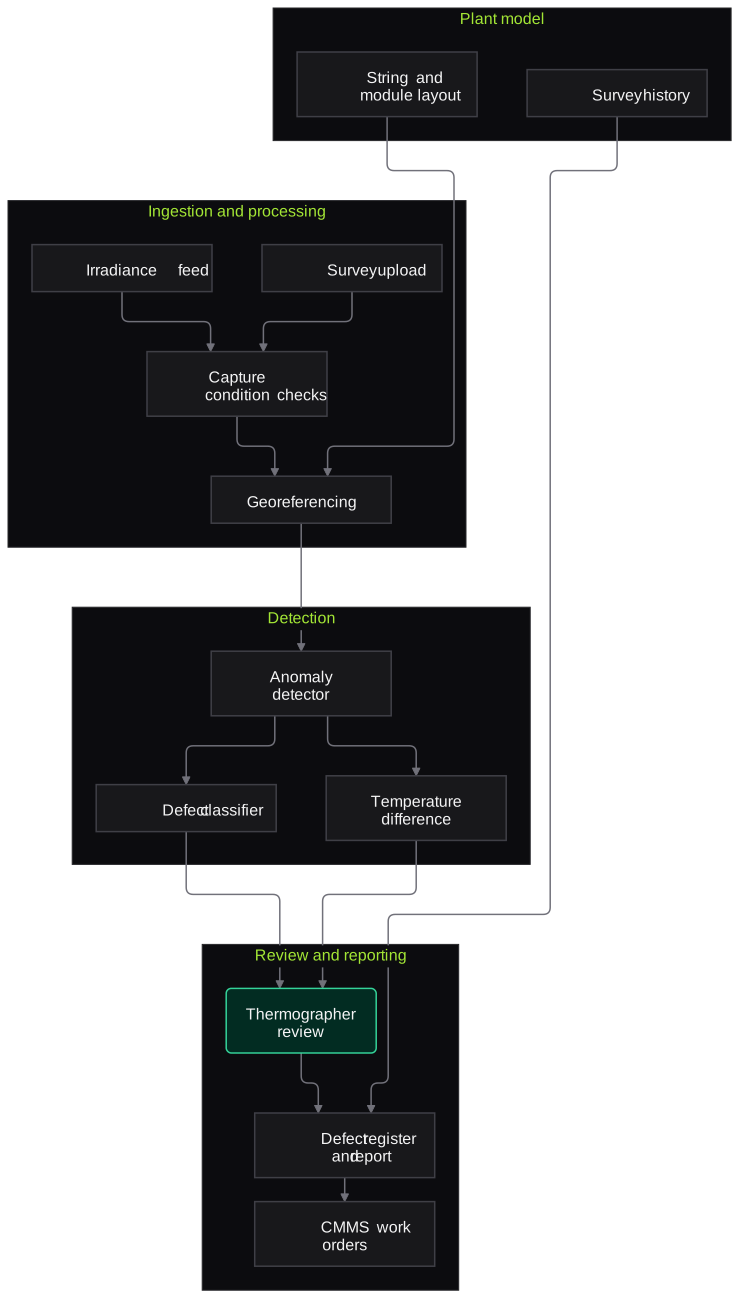
Architecture
- Ingestion and processing
- Survey upload portal or cloud bucket
- Weather station irradiance feed
- Capture condition checks
- Orthomosaic and georeferencing
- Detection
- Anomaly detector
- Defect classifier
- Temperature difference calculator
- Plant model
- As-built layout with string and table mapping
- Survey history store
- Review and reporting
- Thermographer review screen
- Defect register and PDF report
- CMMS and monitoring system connectors
Inputs and outputs
Inputs
- Radiometric thermal images from the drone survey
- RGB images of the same blocks
- Flight logs and GPS data
- Irradiance and ambient temperature from the plant weather station
- As-built layout with string and module mapping
- Previous survey defect registers
Outputs
- Defect register by block, inverter, string and module
- Annotated thermal and RGB evidence per defect
- Survey report for O&M and asset management
- Work orders in the CMMS
- Survey-over-survey comparison of new and repaired defects
Where people stay in control
A qualified thermographer or O&M engineer reviews low-confidence and high-severity anomalies and signs off the report. Decisions on module replacement, cleaning and warranty claims stay with your team.
Integrations
- Drone data platform or cloud storage used by your survey vendor
- SCADA or plant monitoring portal for string currents
- CMMS for work orders
- GIS or CAD exports of the plant layout
- Evidence export for module supplier and EPC warranty claims
Guardrails
- Frames outside valid capture conditions are rejected, not reported as defects
- Every defect links to its source images and coordinates
- Severity rules are versioned and agreed with the O&M team
- Reports are signed off by a named engineer
- Plant layout and generation data kept in your cloud account
Compliance notes
- Report structure can follow the PV thermography practice your O&M or EPC contract specifies, such as IEC TS 62446-3.
- Flights are planned and flown by your licensed drone operator under applicable drone rules; we work only with the resulting data.
A typical pilot
Duration: 3 weeks
One block of an operating plant, using an existing survey dataset plus one new flight flown to agreed capture parameters.
Deliverables
- 01Capture specification for your drone vendor
- 02Processed defect register for the pilot block
- 03Thermographer review screen
- 04Agreement report against expert annotations
- 05Plan and cost for plant-wide and repeat surveys
What we measure
- Detection agreement
- Comparison of system findings with a thermographer's independent annotations of the same images.
- Location accuracy
- Field check of a sample of defects to confirm the mapped string and module position.
- Review load
- Share of anomalies routed to the thermographer for review.
- Report turnaround
- Time from data upload to signed-off report, compared with the current process.
FAQs
01Do you fly the drones?
No. We work with data from your in-house team or survey vendor, and we provide a capture specification covering altitude, overlap, time of day and minimum irradiance so the images are usable for analysis.
02Which cameras and file formats do you support?
Radiometric thermal formats from common drone payloads, such as radiometric JPEG or TIFF, plus standard RGB images and flight logs. We confirm compatibility with a sample from your vendor before the pilot.
03Can the output support warranty claims?
It assembles the evidence suppliers usually ask for: thermal and RGB images per module, temperature difference, location and survey date. Whether a claim is valid under the warranty terms is decided by your team and the supplier.
04Does it work for rooftop and C&I plants?
Yes, where the drone can capture usable angles and layout drawings exist. Rooftop surveys often need more manual layout mapping, which we scope during the pilot.
Related use cases
- Energy, Mining & Utilities
Inspection and Maintenance Report Extraction
Extract readings, observations and recommendations from test reports, NDT surveys, vendor service reports and job cards into your CMMS, with out-of-limit values flagged for engineers.
- Energy, Mining & Utilities
Field Technician Voice Reporting
Linemen, fitters and plant technicians speak their job report in Hindi or a regional language, and the system turns it into a structured CMMS entry for supervisor approval.
- Energy, Mining & Utilities
Permit and Compliance Document Tracking
Turn environmental clearances, consents, explosives and petroleum licences and grid approvals into an obligation register with owners, due dates, reminders and linked evidence.
- Telecom & Contact Centres
Tower and Site Inspection from Drone and Field Photos
Review drone and field-engineer photos of towers and sites for antenna loading, corrosion, missing safety items and incomplete maintenance, and turn them into a defect list engineers verify.

Founded by Akhilesh Mittal. 8 years building a security platform for a New Zealand company. IIT ISM Dhanbad and IMT Ghaziabad. Builds production agentic AI.
Start with one site, one camera cluster or one call queue
Book a discovery call to choose a narrow pilot on your own footage, reports or call recordings. We agree the measures with your team before any build starts.