ESG and BRSR Report Data Extraction
Extract BRSR and sustainability report indicators into a cited, unit-normalised dataset, compare years and flag gaps, inconsistencies and assurance status for ESG analysts.
- Capability:
- Document Intelligence
- Industry:
- Capital Markets & Wealth Management
Who it is for
- Head of ESG Research
- ESG Data Analyst
- Stewardship and Responsible Investment Lead
- Portfolio Monitoring Lead, Private Equity
The problem
SEBI requires the largest listed companies to publish a Business Responsibility and Sustainability Report, and investors, lenders and rating teams want that data in a usable form. The indicators are there, across nine principles and a set of BRSR Core KPIs, but they arrive in different layouts, units and levels of completeness, alongside annual reports and standalone sustainability reports.
Indicators scattered across documents
Emissions, energy, water, waste, workforce and governance data may sit in the BRSR, the annual report and a sustainability report, with different values in each.
Mixed units and restatements
Energy in gigajoules or megawatt hours, emissions with or without intensity ratios and restated prior-year figures make comparison slow.
Gaps are hard to see
A missing leadership indicator or a KPI without assurance is easy to overlook when analysts are keying long lists of fields.
Private portfolio data is messier still
Unlisted portfolio companies send ESG questionnaires and spreadsheets in their own formats.
What we build
We build an ESG extraction pipeline that takes BRSR filings, using the structured XBRL version where it is filed and the PDF otherwise, along with annual and sustainability reports. It locates each indicator by principle and section, extracts reported values with units and reporting boundary, and normalises them to your chosen units. Intensity ratios are recalculated from reported inputs and compared with what the company states. Year-on-year changes, restatements, missing disclosures and assurance status for BRSR Core KPIs are flagged. Every value carries a citation and a label separating reported figures from derived ones. Analysts review anomalies before data reaches your scoring model.
- Reads BRSR XBRL filings where available and PDF reports otherwise, including annual and sustainability reports
- Extracts essential and leadership indicators across the nine principles, plus BRSR Core KPIs
- Normalises units and recalculates intensity ratios from reported inputs
- Flags year-on-year anomalies, restatements, missing disclosures and assurance status
- Labels every value as reported or derived, with a citation to the page or XBRL tag
- Maps indicators to your scoring template and, where requested, to GRI or ISSB fields
How it works
- 01Collect filings and reportsBRSR filings, annual reports, sustainability reports and assurance statements are gathered per company and year.
- 02Locate and extract indicatorsIndicators are found by principle and section and extracted with units, boundary and citation.
- 03Normalise and recalculateUnits are standardised and intensity ratios recomputed from reported inputs.
- 04Check consistencyValues are compared across documents and years, and gaps and assurance status are flagged.
- 05Analyst reviewAnomalies and low-confidence values go to an ESG analyst for confirmation.
- 06Load to your ESG databaseReviewed data is exported to your ESG database, scoring model or data warehouse.

Architecture
- Collection
- Exchange filing downloads including XBRL
- Company investor relations pages
- Portfolio company questionnaire upload
- Extraction
- XBRL parser
- Layout-aware PDF and table parser
- LLM indicator locator and extractor
- Normalisation and checks
- Unit conversion library
- Ratio recalculation
- Year-on-year and cross-document consistency rules
- Review
- Analyst review queue with citations
- Reported versus derived labelling
- Delivery
- ESG database or scoring model adapter
- Data warehouse export
- Version history for restatements
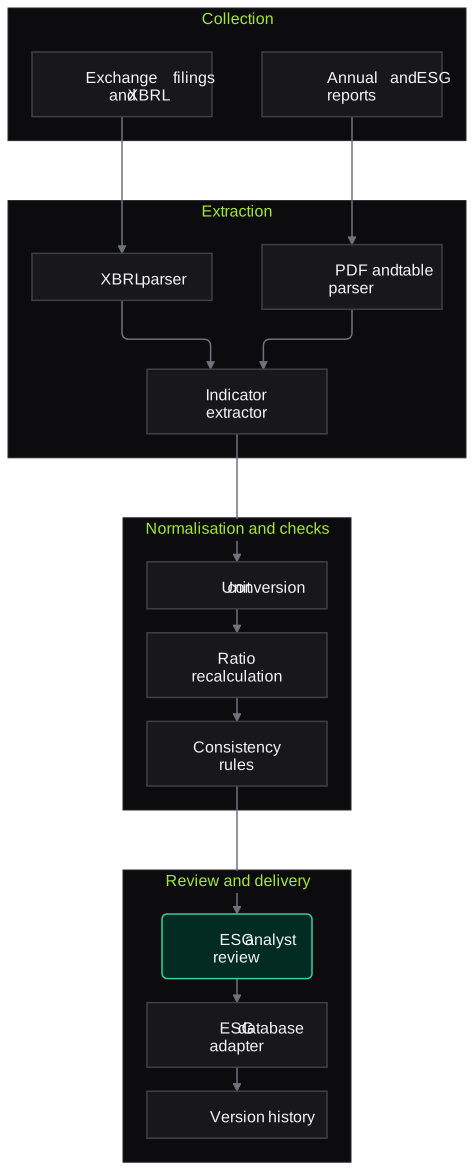
Inputs and outputs
Inputs
- BRSR filings in XBRL and PDF
- Annual reports and standalone sustainability reports
- Assurance statements for BRSR Core KPIs
- Company policies and governance disclosures
- Your ESG scoring template or taxonomy
- ESG questionnaires from unlisted portfolio companies
Outputs
- Indicator-level dataset with citations and units
- Normalised, year-on-year comparable metrics
- Disclosure gap and inconsistency flags
- Assurance status per BRSR Core KPI
- Export to your scoring model or data warehouse
Where people stay in control
ESG analysts confirm anomalies and any value that feeds a score or an engagement decision. Scoring methodology, ratings and stewardship actions remain with your team.
Integrations
- Exchange filing sources and company websites
- ESG data platform or in-house scoring model
- Data warehouse
- Excel for analyst workflows
- Portfolio monitoring tools for private equity
Guardrails
- Every value carries a citation and a unit
- Missing values left blank and flagged, never estimated by the system
- Derived values clearly separated from reported values
- Restatements tracked with version history
- Recalculation differences beyond your tolerance flagged for review
Compliance notes
- SEBI requires the largest listed companies to publish BRSR, with independent assurance or assessment of BRSR Core KPIs being phased in; the pipeline extracts what is reported and flags what is missing.
- Extraction supports, but does not replace, your ESG methodology or the work of assurance providers and ESG rating providers.
A typical pilot
Duration: 3 weeks
BRSR filings and annual reports for the companies in one sector, such as cement or IT services, across two reporting years.
Deliverables
- 01Indicator list mapped to your scoring template
- 02Working pipeline on the pilot companies
- 03Analyst review queue
- 04Accuracy and coverage report
- 05Production plan for your full universe
What we measure
- Indicator extraction accuracy
- Compared with an analyst-entered dataset for the same companies and years.
- BRSR Core KPI coverage
- Share of BRSR Core KPIs located and extracted per company.
- Anomalies confirmed
- Flags reviewed by analysts and classified as genuine issue, restatement or false alarm.
- Analyst time per company
- Timed with and without the pipeline on a sample of companies.
FAQs
01Why not just use the XBRL filings?
Where XBRL is available and complete, we use it first. Analysts also need context from PDFs, such as boundaries, notes and restatements, and data from annual and sustainability reports that XBRL does not cover.
02Can it map to GRI, ISSB or CSRD frameworks?
Yes, as a mapping layer on top of the extracted indicators, for global investors who need it. The mapping is reviewed with your team because definitions do not always line up exactly.
03Does it handle Scope 3 and value chain disclosures?
It extracts whatever the company reports, including Scope 3 and value chain data where disclosed, and labels the stated boundary and method. It does not estimate missing Scope 3 figures.
04Will it calculate ESG scores?
It can apply your scoring formula to reviewed data, but it does not invent a methodology. Scores remain your team's responsibility.
Related use cases
- Capital Markets & Wealth Management
Research Report Summarisation and Data Extraction
Extract ratings, targets, estimates and guidance from broker research and company filings, with cited summaries and revision alerts for your analysts' internal use.
- Capital Markets & Wealth Management
Private Markets Fund Document Extraction
Read capital calls, distribution notices, capital account statements and LPAs from many GPs into structured records, with roll-forward checks and wire-instruction change alerts.
- Accounting, Audit & Consulting
Financial Statement Spreading
Read audited financials, notes and schedules in Schedule III, Ind AS or IFRS layouts and map every line into your spreading template or CMA format, each figure traced to its page.

Founded by Akhilesh Mittal. 8 years building a security platform for a New Zealand company. IIT ISM Dhanbad and IMT Ghaziabad. Builds production agentic AI.
Start with one statement type, queue or chatbot
Book a discovery call and we will scope a short pilot on your de-identified documents or staging systems, with measures agreed before we start.