Financial Statement Spreading
Read audited financials, notes and schedules in Schedule III, Ind AS or IFRS layouts and map every line into your spreading template or CMA format, each figure traced to its page.
- Capability:
- Document Intelligence
- Industry:
- Accounting, Audit & Consulting
Who it is for
- Transaction Advisory Manager
- Valuation Analyst
- CMA and Project Finance Team Lead
- Due Diligence Partner
The problem
Advisory, valuation and project-finance teams spend hours copying balance sheets, profit and loss statements and notes from annual reports into a standard model before any analysis starts. Every company groups items differently, the real detail sits in the notes, and a typo in a re-keyed figure can travel through ratios, CMA data and valuation outputs unnoticed.
No two annual reports look alike
Schedule III, Ind AS and IFRS layouts, standalone and consolidated sets, and scanned older years all need different handling.
Mapping needs the notes
Other current liabilities may hide statutory dues, capital creditors and advances, and the right template line depends on the note breakdown.
Re-keying errors spread
A transposed figure breaks the balance check or, worse, balances by coincidence and flows into every downstream ratio.
Multi-year comparisons drift
Restated comparatives and reclassifications between years are easy to miss when each year is keyed separately.
What we build
We build a spreading assistant that takes annual reports, audited financial statements or MCA-filed financials and maps them into your firm's template: a standard spread, a CMA data format for working capital proposals, or a due diligence databook. It finds the primary statements and notes, extracts every line with its note reference, and proposes a mapping to your template lines based on the note detail rather than the caption alone. Arithmetic checks confirm that subtotals, totals and the balance sheet hold, and that comparatives agree with last year's spread. Lines with low mapping confidence or failed checks are queued for an analyst before ratios are calculated.
- Locates the balance sheet, profit and loss, cash flow and notes in long annual reports, including scanned years
- Extracts line items with note references across standalone, consolidated, current and comparative columns
- Proposes template mappings from note breakdowns and remembers analyst corrections for each client
- Tie-out checks on subtotals, balance sheet balance, cash flow and comparatives against the prior spread
- Flags restatements, reclassifications and auditor qualifications or emphasis-of-matter paragraphs
- Exports to your Excel model, a CMA format or your credit or valuation template
How it works
- 01Upload the financial statementsAnnual reports, audited statements or XBRL filings for the years in scope are added to the engagement.
- 02Locate statements and notesPages are classified so that the primary statements and each note are found, whatever the report's layout.
- 03Extract line itemsFigures are extracted with captions, note references and column context, each linked to its page.
- 04Map to the templateEach line is mapped to your spreading template using the note breakdown and earlier corrections.
- 05Check and confirmTie-out failures and low-confidence mappings go to an analyst, who confirms or corrects them.
- 06Calculate and exportRatios are calculated and the spread is exported with a page-level trace for every figure.

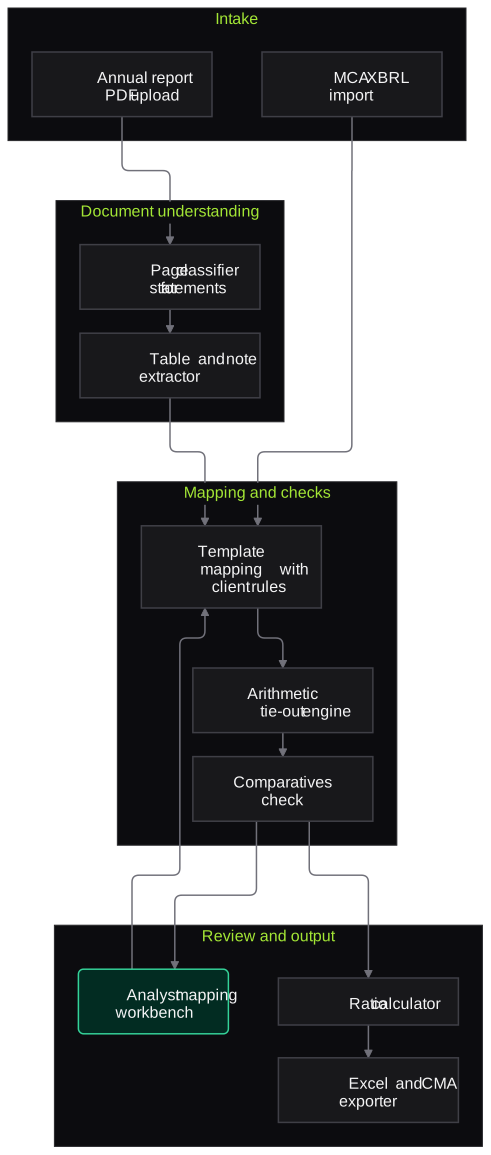
Architecture
- Intake
- PDF upload for annual reports
- XBRL import for MCA filings
- OCR for scanned statements
- Document understanding
- Page classifier for statements and notes
- Table extractor
- LLM line-item and note parser
- Mapping and checks
- Template mapping with client-specific rules
- Arithmetic tie-out engine
- Comparatives checker against prior spreads
- Review
- Analyst mapping workbench
- Correction memory per client and template
- Output
- Ratio calculator
- Excel and CMA exporter
- Audit trail of mappings and edits
Inputs and outputs
Inputs
- Annual reports or audited financial statements (PDF)
- Notes to accounts and schedules
- XBRL financial statements filed with MCA, where available
- Prior-year spreads for the same company
- Your spreading template or CMA format
Outputs
- Multi-year spread in your template
- Mapping table with note references and source pages
- Tie-out exception report
- Ratio sheet
- Flags for qualifications, restatements and reclassifications
Where people stay in control
Analysts confirm every mapping below the confidence threshold and every failed tie-out before ratios are calculated. Interpretation of the numbers, including any credit view, valuation assumption or projection, stays with the advisory team.
Integrations
- Excel models and CMA templates
- Bank loan origination or credit appraisal systems, for CMA submissions
- MCA filings and XBRL files
- SharePoint or Google Drive engagement folders
Guardrails
- Every figure traced to its page and note
- Balance sheet must balance before export
- No silent reclassification; every mapping change is logged with the user
- Analyst corrections reused only for the same client and template
- The model does not generate projections or assumptions
Compliance notes
- Financial statements of unlisted clients are confidential; processing stays in your environment with access limited to the engagement team.
- A spread supports analysis; it is not an audit or assurance opinion on the underlying statements.
A typical pilot
Duration: 3 weeks
Three years of financials for a sample of companies from recent engagements, spread into your current template and compared with your analysts' spreads.
Deliverables
- 01Mapping set-up for your template or CMA format
- 02Working pipeline on the pilot companies
- 03Analyst workbench with tie-out checks
- 04Accuracy report against existing spreads
- 05Roll-out plan and cost estimate
What we measure
- Line-level extraction accuracy
- Extracted figures compared with the analysts' completed spreads for the same companies.
- Mapping agreement
- Share of template mappings analysts accept without change.
- Analyst time per company
- Hands-on time to a reviewed spread, compared with manual spreading.
- Genuine tie-out exceptions
- Analyst feedback on whether each flagged tie-out failure pointed to a real issue.
FAQs
01Does it work on older, scanned annual reports?
Yes, with OCR and layout detection. Scanned pages produce more low-confidence values, which go to the analyst, and the pilot reports accuracy separately for digital and scanned statements.
02Can it use our own spreading template or a bank's CMA format?
Yes. Your template is the target. We set up the mapping to your line items, and analyst corrections are remembered for that client and template.
03Will it generate projections or a credit view?
No. It produces the historical spread, tie-out checks and ratios. Projections, assumptions and any credit or valuation conclusion remain your team's work.
04Does it handle Ind AS, IFRS and consolidated statements?
Yes. It distinguishes standalone from consolidated statements and current from comparative columns, and it flags restated comparatives so they are not mixed with previously reported figures.
Related use cases
- Accounting, Audit & Consulting
Engagement Proposal Drafting
Draft proposals, RFP responses and engagement letters from discovery notes and your firm's past work, with scope, staffing and assumptions laid out for the partner to price and sign.
- Accounting, Audit & Consulting
Audit Sampling and Vouching from Invoices
Select samples from the ledger, pull invoices, GRNs and payment proofs, and check each voucher against the entry, with every exception sent to the audit senior.
- NBFCs & Lending
Bank Statement Analysis for Underwriting
Analyse bank statements from PDFs, scans and Account Aggregator data to surface income, obligations, bounces and red flags, with every figure traceable to transactions.
- Legal
Due Diligence Data Room Review
Index a virtual data room against your request list, extract issues from contracts, corporate records and licences, and draft report tables and query lists for lawyers to confirm.

Founded by Akhilesh Mittal. 8 years building a security platform for a New Zealand company. IIT ISM Dhanbad and IMT Ghaziabad. Builds production agentic AI.
Start with one engagement
Pick one reconciliation, one audit area or one tax-season workflow. We will scope a short pilot on your own documents and show the results against work your team has already done.